Blog
Building Sector Emissions Plateau for First Time Since 2015: What This Means for Climate Action
The Big Picture: Why This Matters?
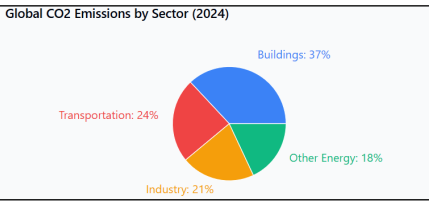
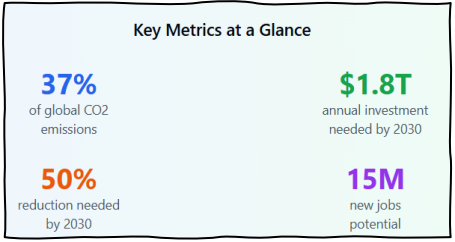
Buildings are responsible for approximately 37% of global energy-related CO₂ emissions, including both:
- Operational emissions (heating, cooling, lighting)
- Embodied carbon from construction materials
That’s more than the entire transportation sector.
The fact that these emissions have plateaued — rather than continued their relentless upward climb — represents a significant shift in trajectory.
But here’s the crucial context: plateau is not enough.
We need deep, sustained reductions to meet our climate goals.
What’s Driving the Plateau?
Based on recent data from the International Energy Agency (IEA) and Global Buildings Performance Network, several factors are converging:
- Energy Efficiency Gains
- LED lighting adoption has accelerated dramatically
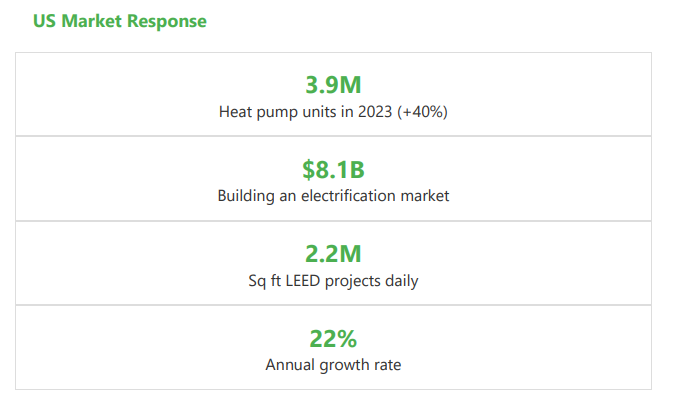
- Heat pump installations increased by 40% in key markets
- Building energy codes have strengthened in major economies
- Smart building technologies are becoming mainstream
- Renewable Energy Integration
- Solar installations on commercial buildings doubled in the past three years
- Grid decarbonization is reducing the carbon intensity of electricity
- Energy storage systems are enabling better renewable integration
3. Construction Industry Transformation
- Mass timber construction is gaining traction as a lower-carbon alternative
- Cement and steel producers are investing in cleaner production methods
- Circular economy principles are being applied to building materials
The Regional Reality Check
The plateau isn’t happening everywhere equally:
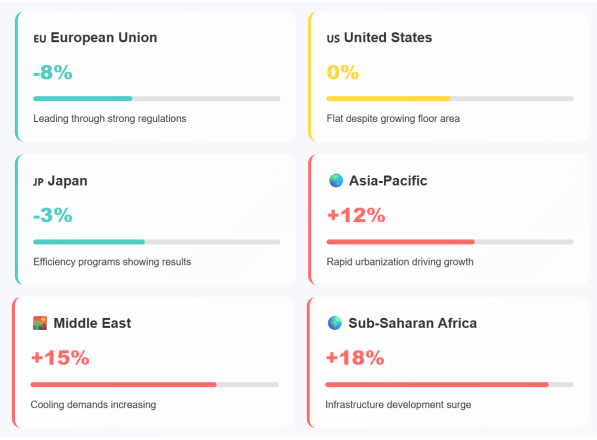
Progressing Regions:
- European Union: Building emissions decreased by 8% since 2020
- United States: Flat emissions despite growing floor area
- Japan: Modest reductions through efficiency programs
Lagging Regions:
- Asia-Pacific: Still seeing growth due to rapid urbanization
- Middle East: Cooling demands driving continued increases
- Sub-Saharan Africa: Infrastructure development outpacing efficiency gains
What This Means for Different Stakeholders
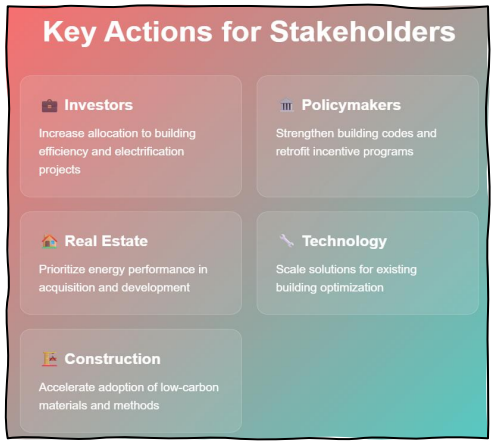
For Real Estate Professionals
- The plateau signals that the market is responding to both regulatory pressure and economic incentives.
- Properties with strong energy performance are commanding premium valuations, while energy-inefficient buildings face obsolescence risk.
For Policymakers
- This moment validates existing policies but also demands acceleration.
- Current measures are working, but the pace must double to meet 2030 targets.
For Investors
- Emissions trajectory is tied to investment flows.
- ESG-focused capital is driving green building demand.
- High-carbon properties face growing stranded asset risks.
For Technology Companies
- The plateau coincides with adoption of smart systems like HVAC, energy platforms, and IoT tools.
- The sector is finally embracing digital transformation.
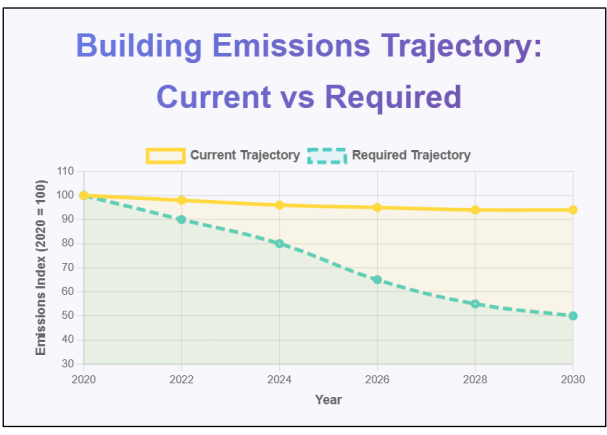
The Challenge Ahead: From Plateau to Decline
While the plateau is encouraging, here’s the challenge ahead:
- Current trajectory: Emissions stable
- Required trajectory: 50% reduction by 203
- Gap: Massive acceleration needed
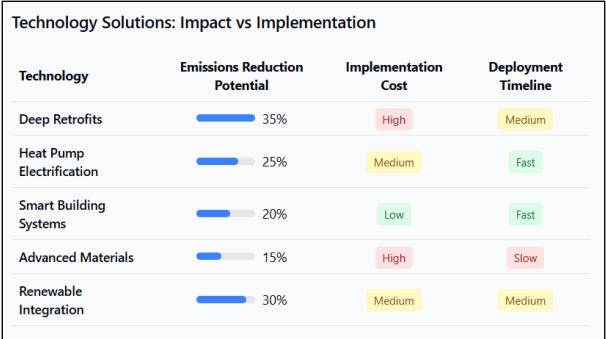
Key Strategies for Breaking Through
- Retrofit Revolution
- Deep energy retrofits can reduce emissions by 50–70% per building.
- Scale needed: thousands to millions annually.
- Electrification Acceleration
- Replace gas heating with electric heat pumps.
- Requires grid decarbonization and massive deployment.
- Embodied Carbon Focus
Accounts for 10–20% of building emissions.- Needs supply chain transformation.
- Smart Systems Integration 🤖
- AI-powered building management systems can cut energy use by 20–30% with minimal capital.
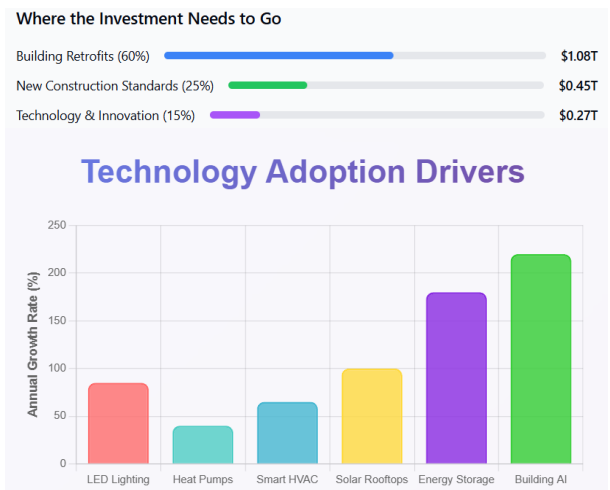
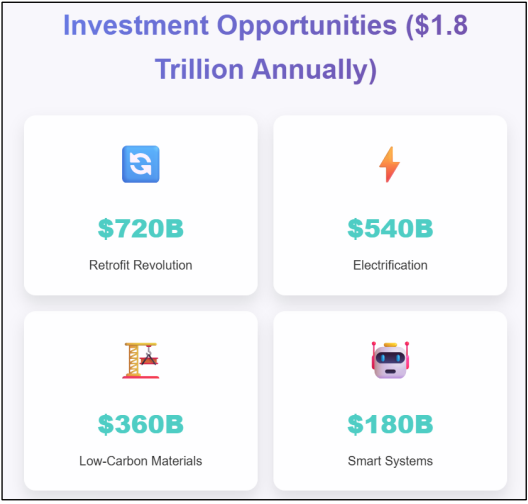
The Investment Imperative
The Investment Imperative The IEA estimates that achieving net-zero buildings requires $1.8 trillion in annual investment globally through 2030. This isn’t just a cost, it’s an economic opportunity:
Global Scenario and Emerging Trends
The plateau in building sector emissions represents more than a statistical milestone,
it reflects a fundamental shift in global climate policy and economic priorities. This
transformation is occurring against a backdrop of increasing geopolitical complexity,
where climate action has become deeply intertwined with trade policy, technological
competition, and economic sovereignty.
Key Global Trends
- Policy Convergence:
Over 70% of global GDP is now covered by net-zero commitments - Technology Transfer Acceleration:
Clean building technologies are crossing borders faster than ever - Financial Architecture Evolution:
Green finance mechanisms have reached $4.3 trillion globally
Standard Harmonization:
International building codes are increasingly aligned on efficiency metrics
Let me know if you’d like this stylized for a slide, blog section, or social media post.
The United States Position: Innovation and Market Mechanisms
The US approach to building emissions reflects its characteristic emphasis on market-driven solutions and technological innovation, shaped by the Inflation Reduction Act (IRA) and state-level initiatives.
US Policy Framework
Federal Level:
- Inflation Reduction Act:
$370 billion in climate investments, with $19 billion specifically allocated for building efficiency - Federal Building Performance Standards:
50% emissions reduction target by 2032 - Clean Energy Tax Credits:
Extended through 2032 for heat pumps, solar installations, and efficiency upgrades
State Leadership:
- California:
Building decarbonization mandate by 2030 - New York:
Local Law 97 requiring emissions reductions for large buildings - Massachusetts:
Net-zero stretch code adoption accelerating
European Union Stance: Regulatory Leadership and Carbon Accountability
The EU has positioned itself as the global leader in building emissions regulation, using its market power to drive international standards through comprehensive policy frameworks.
EU Policy Architecture
Building Performance Framework:
- Energy Performance of Buildings Directive (EPBD): Mandatory renovations for worst-performing buildings
- Fit for 55 Package: 55% emissions reduction by 2030
- Renovation Wave Strategy: €150 billion annual investment target
Regulatory Milestones
- 2025:Energy performance certificates mandatory for all sales/rentals
- 2030: Minimum energy performance standards for commercial buildings
- 2033: Residential buildings must meet efficiency thresholds
- 2050: Carbon neutrality requirement for all buildings
The EU has positioned itself as the global leader in building emissions regulation, using its market power to drive international standards through comprehensive policy frameworks.
CBAM Mechanism: Game-Changer for Global Building
Materials 🏭
The EU’s Carbon Border Adjustment Mechanism (CBAM) represents a paradigm shift that directly impacts the building sector through its coverage of cement, steel, and aluminum- critical construction materials.
CBAM Implementation Timeline
Phase 1 (2023-2026): Reporting Only
- Companies report embedded carbon in imports
- Data collection for future pricing mechanisms
- Capacity building for developing country exporters
Phase 2 (2027+): Full Implementation
- Carbon pricing on covered imports
- CBAM certificates required for market access
- Revenue recycling to climate finance potentially
India’s Strategic Position: Balancing Development and
Climate Action 🇮🇳
India’s approach to building emissions reflects its unique position as a major
emerging economy with massive infrastructure needs and growing climate
commitments.
Scale of Challenge:
- Urban Population: 600 million by 2030 (from 460 million in 2020)
- Housing Demand: 25 million new units needed by 2030
- Commercial Space: 1.7 billion sq ft addition required
- Infrastructure Investment: $4.5 trillion needed through 2030
India’s Way Ahead: Strategic Pathways for Climate
Leadership
Strategic Priorities for India
- Indigenous Technology Development
- Research Ecosystem: Establish 10 centers of excellence for building technologies
- Startup Support: $500 million fund for clean building technology startups
- IP Strategy: Develop patent portfolio in critical technologies
- Manufacturing Base: Achieve 70% domestic content in clean building technologies by 2030
- Policy Framework Evolution
- Regulatory Harmonization: Uniform building codes across all states by 2027
- Performance Standards: Mandatory energy labeling for all buildings over 500 m2
- Financial Mechanisms: Green building finance at 2% below market rates
- Enforcement Systems: Digital monitoring and compliance platforms
The Challenge Ahead: Three Scenarios
- Scenario 1: Status Quo
If current trends continue, building emissions remain flat through 2030. This falls far
short of climate goals but represents better performance than historical trends.
- Scenario 2: Accelerated Action
With strong policy support and increased investment, building emissions could
decline 30% by 2030. This would put the sector on track for net-zero by 2050.
- Scenario 3: Breakthrough Innovation
Rapid deployment of new technologies (advanced materials, AI optimization,
integrated renewables) could enable 50% emissions reduction by 2030.
Accelerated Action | $1400B | 30% | 12M |
Breakthrough | $1800B | 50% | 15M |
Temperature Impact
- Status Quo: +2.5°C
- Accelerated: +2.0°C
- Breakthrough: +1.5°C
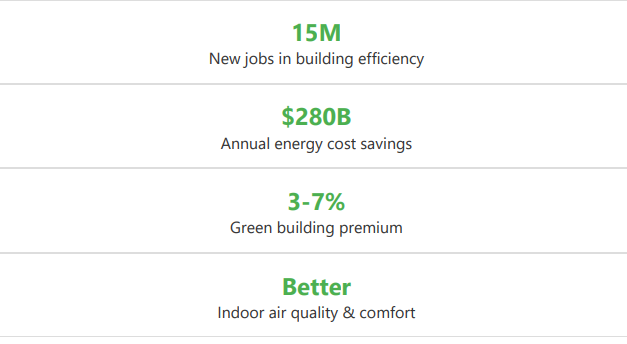
Economic Impact
- Energy Savings: $280B/year
- Avoided Costs: $2.4T by 2050
- Green Premium: 3–7%
The Bottom Line
The plateau in building sector emissions is a significant milestone, but it’s just the beginning. We’ve proven that emissions can be decoupled from economic growth and building activity. Now we need to accelerate the transition from plateau to steep decline. The next five years will be critical. The decisions we make about building codes, investment priorities, and technology deployment will determine whether this plateau becomes a launching pad for deep decarbonization or a brief pause before emissions resume their upward climb.
The Critical Transition Ahead
The Paradox of Progress
The emissions plateau represents a fundamental paradox: decoupling is proven but insufficient. We’ve broken the link between economic growth and emissions, validating that technology and policy can bend the curve. Yet climate math demands rapid decline, not stability. This success exposes three realities:
- Geographic inequity creates a justice crisis, EU emissions dropped 8% while developing regions still grow, raising questions about who cuts emissions versus who deserves development.
- Sectoral transformation is birthing new industries (deep retrofits, performance optimization) while disrupting traditional ones, determining future economic competitiveness and job creation.
- Acceleration imperative requires moving from incremental gains to breakthrough transformation in the next five years.
Geopolitical Stakes: Climate as Economic Strategy
Climate action has become inseparable from economic strategy and technological
sovereignty:
- EU’s “Regulatory Imperialism”: CBAM and building standards leverage
market access to drive global standards, potentially accelerating technology
transfer while creating new dependencies.
- US Industrial Policy: The IRA’s $19 billion building efficiency investment is a
strategic bet on American clean tech leadership, reframing climate action as
competitive advantage.
- India’s Development Dilemma: With 600 million urban residents by 2030,
India’s next five years will lock in decades of emissions trajectories while
pursuing indigenous technology development.
Innovation Beyond Incremental Change
Current success comes from scaling existing technologies- LEDs, heat pumps, insulation. Moving from plateau to steep decline demands breakthrough innovation across three frontiers:
- Materials Revolution: Carbon-negative concrete, bio-based materials, and programmable building skins could transform both embodied and operational carbon.
- Systems Intelligence: AI-powered optimization promises 20-30% consumption reductions through real-time building management.
- Business Model Transformation: Building-as-a-service and performance contracting could unlock massive retrofit capital by shifting from ownership to outcomes.
Primary Sources
- International Energy Agency (IEA) – Buildings and Construction Progress
- Report 2024
- UN Environment Programme (UNEP) – Global Status Report for Buildings and
- Construction 2024
- Global Buildings Performance Network – Annual Report 2024
- Rocky Mountain Institute – Building Electrification Trends Report
- World Green Building Council – Embodied Carbon Toolkit
Limitations
- Data availability varies by region, with developing countries often underrepresented
- Embodied carbon calculations rely on estimates due to limited tracking
- Future projections based on current trends and policy commitments
- Economic analysis uses 2024 cost and pricing assumptions
What’s your take on this plateau? Do you see similar trends in your market or
sector?
#ClimateAction #GreenBuilding #SustainableConstruction #EnergyEfficiency
#NetZero #ESG #RealEstate #ClimateChange
The numbers are in, and they tell a story of both progress and urgency.
For the first time since 2015, global building sector emissions have plateaued. This isn’t just a statistical blip, it’s a potential turning point in our fight against climate change. But before we celebrate, let’s dive into what this really means for our climate future.
The Big Picture: Why This Matters?
Buildings are responsible for approximately 37% of global energy-related CO₂ emissions, including both:
- Operational emissions (heating, cooling, lighting)
- Embodied carbon from construction materials
That’s more than the entire transportation sector.
The fact that these emissions have plateaued — rather than continued their relentless upward climb — represents a significant shift in trajectory.
But here’s the crucial context: plateau is not enough.
We need deep, sustained reductions to meet our climate goals.
What’s Driving the Plateau?
Based on recent data from the International Energy Agency (IEA) and Global Buildings Performance Network, several factors are converging:
- Energy Efficiency Gains
- LED lighting adoption has accelerated dramatically
- Heat pump installations increased by 40% in key markets
- Building energy codes have strengthened in major economies
- Smart building technologies are becoming mainstream
- Renewable Energy Integration
- Solar installations on commercial buildings doubled in the past three years
- Grid decarbonization is reducing the carbon intensity of electricity
- Energy storage systems are enabling better renewable integration
3. Construction Industry Transformation
- Mass timber construction is gaining traction as a lower-carbon alternative
- Cement and steel producers are investing in cleaner production methods
- Circular economy principles are being applied to building materials
The Regional Reality Check
The plateau isn’t happening everywhere equally:
Progressing Regions:
- European Union: Building emissions decreased by 8% since 2020
- United States: Flat emissions despite growing floor area
- Japan: Modest reductions through efficiency programs
Lagging Regions:
- Asia-Pacific: Still seeing growth due to rapid urbanization
- Middle East: Cooling demands driving continued increases
- Sub-Saharan Africa: Infrastructure development outpacing efficiency gains
What This Means for Different Stakeholders
For Real Estate Professionals
- The plateau signals that the market is responding to both regulatory pressure and economic incentives.
- Properties with strong energy performance are commanding premium valuations, while energy-inefficient buildings face obsolescence risk.
For Policymakers
- This moment validates existing policies but also demands acceleration.
- Current measures are working, but the pace must double to meet 2030 targets.
For Investors
- Emissions trajectory is tied to investment flows.
- ESG-focused capital is driving green building demand.
- High-carbon properties face growing stranded asset risks.
For Technology Companies
- The plateau coincides with adoption of smart systems like HVAC, energy platforms, and IoT tools.
- The sector is finally embracing digital transformation.
The Challenge Ahead: From Plateau to Decline
While the plateau is encouraging, here’s the challenge ahead:
- Current trajectory: Emissions stable
- Required trajectory: 50% reduction by 203
- Gap: Massive acceleration needed
Key Strategies for Breaking Through
- Retrofit Revolution
- Deep energy retrofits can reduce emissions by 50–70% per building.
- Scale needed: thousands to millions annually.
- Electrification Acceleration
- Replace gas heating with electric heat pumps.
- Requires grid decarbonization and massive deployment.
- Embodied Carbon Focus
Accounts for 10–20% of building emissions.- Needs supply chain transformation.
- Smart Systems Integration 🤖
- AI-powered building management systems can cut energy use by 20–30% with minimal capital.
The Investment Imperative
The Investment Imperative The IEA estimates that achieving net-zero buildings requires $1.8 trillion in annual investment globally through 2030. This isn’t just a cost, it’s an economic opportunity:
Global Scenario and Emerging Trends
The plateau in building sector emissions represents more than a statistical milestone,
it reflects a fundamental shift in global climate policy and economic priorities. This
transformation is occurring against a backdrop of increasing geopolitical complexity,
where climate action has become deeply intertwined with trade policy, technological
competition, and economic sovereignty.
Key Global Trends
- Policy Convergence:
Over 70% of global GDP is now covered by net-zero commitments - Technology Transfer Acceleration:
Clean building technologies are crossing borders faster than ever - Financial Architecture Evolution:
Green finance mechanisms have reached $4.3 trillion globally
Standard Harmonization:
International building codes are increasingly aligned on efficiency metrics
Let me know if you’d like this stylized for a slide, blog section, or social media post.
The United States Position: Innovation and Market Mechanisms
The US approach to building emissions reflects its characteristic emphasis on market-driven solutions and technological innovation, shaped by the Inflation Reduction Act (IRA) and state-level initiatives.
US Policy Framework
Federal Level:
- Inflation Reduction Act:
$370 billion in climate investments, with $19 billion specifically allocated for building efficiency - Federal Building Performance Standards:
50% emissions reduction target by 2032 - Clean Energy Tax Credits:
Extended through 2032 for heat pumps, solar installations, and efficiency upgrades
State Leadership:
- California:
Building decarbonization mandate by 2030 - New York:
Local Law 97 requiring emissions reductions for large buildings - Massachusetts:
Net-zero stretch code adoption accelerating
European Union Stance: Regulatory Leadership and Carbon Accountability
The EU has positioned itself as the global leader in building emissions regulation, using its market power to drive international standards through comprehensive policy frameworks.
EU Policy Architecture
Building Performance Framework:
- Energy Performance of Buildings Directive (EPBD): Mandatory renovations for worst-performing buildings
- Fit for 55 Package: 55% emissions reduction by 2030
- Renovation Wave Strategy: €150 billion annual investment target
Regulatory Milestones
- 2025:Energy performance certificates mandatory for all sales/rentals
- 2030: Minimum energy performance standards for commercial buildings
- 2033: Residential buildings must meet efficiency thresholds
- 2050: Carbon neutrality requirement for all buildings
The EU has positioned itself as the global leader in building emissions regulation, using its market power to drive international standards through comprehensive policy frameworks.
CBAM Mechanism: Game-Changer for Global Building
Materials 🏭
The EU’s Carbon Border Adjustment Mechanism (CBAM) represents a paradigm shift that directly impacts the building sector through its coverage of cement, steel, and aluminum- critical construction materials.
CBAM Implementation Timeline
Phase 1 (2023-2026): Reporting Only
- Companies report embedded carbon in imports
- Data collection for future pricing mechanisms
- Capacity building for developing country exporters
Phase 2 (2027+): Full Implementation
- Carbon pricing on covered imports
- CBAM certificates required for market access
- Revenue recycling to climate finance potentially
India’s Strategic Position: Balancing Development and
Climate Action 🇮🇳
India’s approach to building emissions reflects its unique position as a major
emerging economy with massive infrastructure needs and growing climate
commitments.
Scale of Challenge:
- Urban Population: 600 million by 2030 (from 460 million in 2020)
- Housing Demand: 25 million new units needed by 2030
- Commercial Space: 1.7 billion sq ft addition required
- Infrastructure Investment: $4.5 trillion needed through 2030
India’s Way Ahead: Strategic Pathways for Climate
Leadership
Strategic Priorities for India
- Indigenous Technology Development
- Research Ecosystem: Establish 10 centers of excellence for building technologies
- Startup Support: $500 million fund for clean building technology startups
- IP Strategy: Develop patent portfolio in critical technologies
- Manufacturing Base: Achieve 70% domestic content in clean building technologies by 2030
- Policy Framework Evolution
- Regulatory Harmonization: Uniform building codes across all states by 2027
- Performance Standards: Mandatory energy labeling for all buildings over 500 m2
- Financial Mechanisms: Green building finance at 2% below market rates
- Enforcement Systems: Digital monitoring and compliance platforms
The Challenge Ahead: Three Scenarios
- Scenario 1: Status Quo
If current trends continue, building emissions remain flat through 2030. This falls far
short of climate goals but represents better performance than historical trends.
- Scenario 2: Accelerated Action
With strong policy support and increased investment, building emissions could
decline 30% by 2030. This would put the sector on track for net-zero by 2050.
- Scenario 3: Breakthrough Innovation
Rapid deployment of new technologies (advanced materials, AI optimization,
integrated renewables) could enable 50% emissions reduction by 2030.
Accelerated Action | $1400B | 30% | 12M |
Breakthrough | $1800B | 50% | 15M |
Temperature Impact
- Status Quo: +2.5°C
- Accelerated: +2.0°C
- Breakthrough: +1.5°C
Economic Impact
- Energy Savings: $280B/year
- Avoided Costs: $2.4T by 2050
- Green Premium: 3–7%
The Bottom Line
The plateau in building sector emissions is a significant milestone, but it’s just the beginning. We’ve proven that emissions can be decoupled from economic growth and building activity. Now we need to accelerate the transition from plateau to steep decline. The next five years will be critical. The decisions we make about building codes, investment priorities, and technology deployment will determine whether this plateau becomes a launching pad for deep decarbonization or a brief pause before emissions resume their upward climb.
The Critical Transition Ahead
The Paradox of Progress
The emissions plateau represents a fundamental paradox: decoupling is proven but insufficient. We’ve broken the link between economic growth and emissions, validating that technology and policy can bend the curve. Yet climate math demands rapid decline, not stability. This success exposes three realities:
- Geographic inequity creates a justice crisis, EU emissions dropped 8% while developing regions still grow, raising questions about who cuts emissions versus who deserves development.
- Sectoral transformation is birthing new industries (deep retrofits, performance optimization) while disrupting traditional ones, determining future economic competitiveness and job creation.
- Acceleration imperative requires moving from incremental gains to breakthrough transformation in the next five years.
Geopolitical Stakes: Climate as Economic Strategy
Climate action has become inseparable from economic strategy and technological
sovereignty:
- EU’s “Regulatory Imperialism”: CBAM and building standards leverage
market access to drive global standards, potentially accelerating technology
transfer while creating new dependencies.
- US Industrial Policy: The IRA’s $19 billion building efficiency investment is a
strategic bet on American clean tech leadership, reframing climate action as
competitive advantage.
- India’s Development Dilemma: With 600 million urban residents by 2030,
India’s next five years will lock in decades of emissions trajectories while
pursuing indigenous technology development.
Innovation Beyond Incremental Change
Current success comes from scaling existing technologies- LEDs, heat pumps, insulation. Moving from plateau to steep decline demands breakthrough innovation across three frontiers:
- Materials Revolution: Carbon-negative concrete, bio-based materials, and programmable building skins could transform both embodied and operational carbon.
- Systems Intelligence: AI-powered optimization promises 20-30% consumption reductions through real-time building management.
- Business Model Transformation: Building-as-a-service and performance contracting could unlock massive retrofit capital by shifting from ownership to outcomes.
Primary Sources
- International Energy Agency (IEA) – Buildings and Construction Progress
- Report 2024
- UN Environment Programme (UNEP) – Global Status Report for Buildings and
- Construction 2024
- Global Buildings Performance Network – Annual Report 2024
- Rocky Mountain Institute – Building Electrification Trends Report
- World Green Building Council – Embodied Carbon Toolkit
Limitations
- Data availability varies by region, with developing countries often underrepresented
- Embodied carbon calculations rely on estimates due to limited tracking
- Future projections based on current trends and policy commitments
- Economic analysis uses 2024 cost and pricing assumptions
What’s your take on this plateau? Do you see similar trends in your market or
sector?
#ClimateAction #GreenBuilding #SustainableConstruction #EnergyEfficiency
#NetZero #ESG #RealEstate #ClimateChange